Report Catalog
The reports found in this catalog ensure data consistency, integrity, transparency and the ability to perform ad-hoc analysis through the use of the Tableau data visualization tool. These data are refreshed regularly and are managed by the Office of Organizational Effectiveness, Planning and Assessment as part of the “Operation Clarity” initiative that launched in the Spring of 2021. Reports are permission (ONYEN) based. The intent of this catalog is to enable the primary audience to utilize the data to inform and optimize decision making.
To access a report click on the View Report link in the Report Access column and follow the instructions.
as of Mar. 22, 2024
| Category | Primary Audience | Report Name | Status | Years of Data | Report Access |
|---|---|---|---|---|---|
| Academic | Faculty | Teaching Effort Guidelines | 9 - Diagnostic Review | Spring 2021 to Present | View Report |
| Academic | CAO | Course Evaluations | 9 - Diagnostic Review | 2018 to Present | View Report |
| Academic | CAO | Course Delivery Efficiency | 9 - Diagnostic Review | Spring 2021 to Present | View Report |
| Academic | CAO | Assessment Calendar (PharmD) | 9 - Diagnostic Review | 2018 to Present | View Report |
| Operations | Division Chairs | Faculty Activity Planned Effort | 9 - Diagnostic Review | 2018 to Present | View Report |
| Academic | CAO | Curriculum Topic Mapping (PharmD) | 9 - Diagnostic Review | 2018 to Present | View Report |
| Operations | CAO | Survey Volume | 3 - Exploration | 2021 to Present | Expected Q2 of 2024 |
| Research | EVD-Research | Externally Funded Proposals and Awards | 9 - Diagnostic Review | 2016 to Present | View Report |
| Research | CAO | Faculty Salary Offset | 9 - Diagnostic Review | 2017 to Present | View Report |
| Research | Division Chairs | Publications and Citations | 9 - Diagnostic Review | 2018 to Present | View Report |
| Research | EVD-Research | Extramural Funding Performance (Win Rate) | 9 - Diagnostic Review | 2016 to Present | View Report |
| Operations | HR | Well-Being Baseline Assessment | 9 – Diagnostic Review | 2021 to Present | View Report |
| Academic | Division Chairs | Instructional Assignments and Effort | 9 - Diagnostic Review | 2021 to Present | View Report |
| Academic | Division Chairs | Educator Evaluations | 9 - Diagnostic Review | 2018 to Present | View Report |
| Academic | PDLT | PharmD First-Destination Career Placement Report | 9 - Diagnostic Review | 2019 to Present | View Report |
| Operations | COO | Service Operations Survey | 9 - Diagnostic Review | 2023 to Present | View Report |
| Operations | Division Chairs | CBMC FY24 Budget vs. Actual Report | 9 - Diagnostic Review | July to Present | View Report |
| Operations | Division Chairs | DPET FY24 Budget vs. Actual Report | 9 - Diagnostic Review | July to Present | View Report |
| Operations | Division Chairs | DPMP FY24 Budget vs. Actual Report | 9 - Diagnostic Review | July to Present | View Report |
| Operations | Division Chairs | DPOP FY24 Budget vs. Actual Report | 9 - Diagnostic Review | July to Present | View Report |
| Operations | Division Chairs | PACE FY23 Budget vs. Actual Report | 9 - Diagnostic Review | July to Present | View Report |
| Research | EVD-Research | Translation and Commercialization | 9 - Diagnostic Review | 2015 to Present | View Report |
| Operations | Division Chairs | EII Internally Funded Awards | 9 - Diagnostic Review | 2018 to Present | View Report |
| Academic | PDLT | PharmD Didactic Course Assessment Load | 9 - Diagnostic Review | 2019 to Present | View Report |
| Academic | CAO | Graduation Rate Report | 6 – Initial Visualization | 2019 to Present | Expected Q2 of 2024 |
| Academic | CAO | Incoming Student Headcount | 9 - Diagnostic Review | 2019 to Present | View Report |
| Academic | CAO | Enrolled Student Headcount | 9 - Diagnostic Review | 2019 to Present | View Report |
| Academic | CAO | Degrees Conferred | 9 - Diagnostic Review | 2019 to Present | View Report |
| Operations | HR | Employee Professional Development | 9 - Diagnostic Review | 2018 to Present | View Report |
| Academic | CAO | Internal Service Assignments | 9 - Diagnostic Review | 2020 to Present | View Report |
| Operations | HR | Workforce Headcount Report | 9 - Diagnostic Review | 2017 to Present | View Report |
| Academic | CAO | Faculty Salary Equity | 9 - Diagnostic Review | 2018 to Present | View Report |
| Academic | CAO | Faculty Salary OSR Offset | 9 - Diagnostic Review | 2017 to Present | View Report |
| Operations | HR | Well-Being Baseline Assessment | 9 - Diagnostic Review | 2021 | View Report |
| Operations | OSA | Eshelman Care Team Referrals | 6 - Initial Visualization | 2018 to Present | Expected Q4 of 2024 |
| Operations | Admissions | PharmD Admissions Cycle | 9 - Diagnostic Review | 2015 to Present | View Report |
| Operations | PDLT | PharmD Student Grade Performance | 6 - Initial Visualization | 2021 to Present | Expected Q3 of 2024 |
| Operations | Admissions | Admissions/Recruitment FY24 Budget vs. Actual Report | 7 – Stakeholder Review | FY 24 | View Report |
| Operations | Asheville | Asheville FY24 Budget vs. Actual Report | 7 – Stakeholder Review | FY 24 | View Report |
| Operations | CAO | CAO - Office of the Dean FY24 Budget vs. Actual Report | 7 – Stakeholder Review | FY 24 | View Report |
| Operations | CIPhER | CIPhER FY24 Budget vs. Actual Report | 7 – Stakeholder Review | FY 24 | View Report |
| Operations | Easter NC | Eastern NC FY24 Budget vs. Actual Report | 7 – Stakeholder Review | FY 24 | View Report |
| Operations | Facilities | Facilities FY24 Budget vs. Actual Report | 7 – Stakeholder Review | FY 24 | View Report |
| Operations | Finance | Finance FY24 Budget vs. Actual Report | 7 – Stakeholder Review | FY 24 | View Report |
| Operations | Global | Global Engagement FY24 Budget vs. Actual Report | 7 – Stakeholder Review | FY 24 | View Report |
| Operations | HR | HR FY24 Budget vs. Actual Report | 7 – Stakeholder Review | FY 24 | View Report |
| Operations | Marcom | Marcom FY24 Budget vs. Actual Report | 7 – Stakeholder Review | FY 24 | View Report |
| Operations | ODI | ODI FY24 Budget vs. Actual Report | 7 – Stakeholder Review | FY 24 | View Report |
| Operations | OE | OE FY24 Budget vs. Actual Report | 7 – Stakeholder Review | FY 24 | View Report |
| Operations | Dean | Office of the Dean FY24 Budget vs. Actual Report | 7 – Stakeholder Review | FY 24 | View Report |
| Operations | OSA | OSA FY24 Budget vs. Actual Report | 7 – Stakeholder Review | FY 24 | View Report |
| Operations | Prof Ed | Professional Education FY24 Budget vs. Actual Report | 7 – Stakeholder Review | FY 24 | View Report |
| Operations | Experiential | Experiential Programs FY24 Budget vs. Actual Report | 7 – Stakeholder Review | FY 24 | View Report |
| Operations | Operations | Operations FY24 Budget vs. Actual Report | 7 – Stakeholder Review | FY 24 | View Report |
| Operations | TAs | TAs (R0174) FY24 Budget vs. Actual Report | 7 – Stakeholder Review | FY 24 | View Report |
| Operations | IET | IET FY24 Budget vs. Actual Report | 7 – Stakeholder Review | FY 24 | View Report |
as of Sept. 6, 2022
| Data Readiness Status | Explanation |
|---|---|
| 1 - Needs Assessment | Key stakeholders are consulted regarding data needs and authoritative data locations |
| 2 - SME Request | Data Subject Mater Experts (SMEs) are identified and meetings are conducted to discuss data access and data models |
| 3 - Exploration | Data is explored for completeness and usability |
| 4 - Validation | Data is validated to answer key questions and desired visualizations |
| 5 - Prototype | Data is prototyped into Tableau reports to establish dimensions and filters |
| 6 - Initial Visualization | Report requirements are transformed into initial reporting views |
| 7 - Stakeholder Review | Tableau report is reviewed for specific stakeholder feedback |
| 8 - DST Review | Report is sent to the Data Strategy Team (DST) for directional feedback |
| 9 - Diagnostic Review | Summary “Metrics that Matter” are explored as part of data diagnostics to assess data gaps and help establish final use cases |
| 10 - Published | Report demonstration is finalized, stakeholder groups are identified, notified and trained. Report permissions are finalized |
as of Feb. 03, 2022
| Principle | Essential Guidance |
|---|---|
| 1. Data Evolution / Not Revolution | • The Tableau dashboards are a work-in-progress and provide access to more data than we have ever had at our fingertips. • Dig in, utilize the filters, and explore how the data can be useful to you. Having access to this much data is new for the School and can be overwhelming. • Please view this as a journey towards increased use of data to inform the work we all do. This is an iterative process and refinements will continue to be made over time. Your input is important and essential to creating usefulness for each group of stakeholders. |
| 2. Data Exploration – Seeking Usefulness | • At any time, please reach out to the Office of OE with any questions or discrepancies you note. • Time can be set aside to help stakeholders to navigate the data, better understand its utility, and identify opportunities for refinement and improvement. • Providing insight and feedback into additional data needs, raising questions, and identifying creative approaches to use of the data are encouraged and valued. |
| 3. Building a Data Culture | • Use the data in context with all sources of information, including important qualitative input. Rich insights typically are found at the intersection of the quantitative and qualitative. • Importantly, it is key to understand what the data are showing, how it can be used in the context of other data points, and where it may fall short in answering specific questions. • Questioning data and prioritizing answers and needs should be a collegial and transparent activity. Providing data is about aligning to our WE CARE values to help ensure continued excellence, commitment, accountability, and respect, while maintaining an equitable workplace. |
as of Apr. 19, 2023
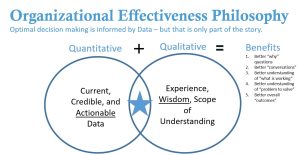
Creating a data-driven culture is the result of thoughtful and consistent planning by leaders who understand where they want to be in the future and then effectively use data (quantitative and qualitative) in order to make the case for change. At the Eshelman School of Pharmacy, our data strategy consists of 6 concurrent phases and is guided by the following philosophy and core principles:
| Core Principles | Principles in Action |
|---|---|
| “Impact Matters” | The numbers in the ESOP Annual Impact Report are the starting point. |
| “Relationships Matter” | Actively participate in all UNC ITS data security and governance policies. |
| “Experience Matters” | Seek to learn from and gain guidance from internal UNC resources deployed for similar projects. |
| “Transparency Matters” | Create transparency around “data deserts” and “data silos” to create a complete understanding of the situation and evaluate pros and cons of change. |
| “Awareness Matters” | Streamline data collection in important educational areas for longitudinal study and bring visibility and awareness to data collection efforts. |
| “Champions Matter” | Develop data champions who own the data and use it to inform decision making and continuous quality improvement. |
The data strategy has the following concurrent phases, key actions and outcomes.
| Phase | Key Actions | School Value and Impact |
|---|---|---|
| Inventory | • Catalog data systems, models, maturity, and governance structures. • Identify subject matter experts • Prioritize targets for deeper analysis. | Prioritization of data to support effective and consistent reporting for the annual ESOP Impact Report, Factbook and Accreditation. |
| Infrastructure | • Leverage existing UNC data systems, visualization tools and support structures. • Understand and comply with all data governance policies and standards. | Partnership with UNC Office of Institutional Research and Assessment (OIRA), ITS Datamart and UNC Systems Office / HelioCampus for Insight Data in the core areas of Human Resources Datamart (HRDM), Finance Datamart (FDM) and Student Datamart (SDM). |
| Illumination | • Worked collaboratively with key data Subject Matter Experts and key stakeholder to visualize data and key trends. • Utilized UNC Tableau infrastructure to create dozens of dashboards reports. • Established base permission model for data access and data refresh cycles. | Development, launch and maintain the School’s Report Catalog. |
| Insights | • Partner with accountable units and committees to develop deeper understanding of “where we have been” in order to develop key driver insights. | Summary insights reports are presented to the Dean’s Council quarterly after a thorough “closed-loop” process to ensure all stakeholders can weigh-in on the data and potential continuous improvement initiatives. |
| Indicators | • Partner with accountable units and committees to establish and track key indices. • Discuss and establish targets (needs improvement, target range, worthy of recognition) for future index performance that is aligned to the School and unit’s strategic goals and culture. | An example of a useful index would be the PharmD Application Yield. The key question is – What % of our students accept admission to the School (Yield) and how is this trending over time? What are the most important drivers of Yield and how are those drivers influenced to achieve the Yield % outcomes we desire? |
| Improvement | • Partner with accountable units and committees to develop and track CQI initiatives to help “move the needle” towards their desired target index. | Ensure that all improvement initiatives and targets are properly aligned to the Core Values of the School. |
as of Apr. 19, 2023
| Phase and Activity | Responsible Team | Typical Duration |
|---|---|---|
| Phase I - Statement of Work Phase Identify project scope, goals, project contacts, types of analyses, deliverables, and opportunities to collaborate | • OE – Lead Consultant | ~1 week |
| Phase II – Discovery Phase Identify and validate specific data to be analyzed and identify reliable data sources | • OE – Lead Consultant • Senior Data Analyst | ~1 week |
| Phase III – Prototype Phase Construct initial visualization strategy “wireframes” in consultation with domain experts | • OE – Lead Consultant • Senior Data Analyst • Data Subject Matter Expert(s) | ~1 week |
| Phase IV – Data Transformation Phase Retrieve and prepare data | • OE – Lead Consultant • Senior Data Analyst | ~1 – 2 weeks |
| Phase V – Visualization Phase Run analyses; produce visualizations; validate visualizations | • OE – Lead Consultant • Senior Data Analyst | ~1 week |
| Phase VI – Findings Review and Refine Phase Share initial analyses with data SME for input / gain approvals | • OE – Lead Consultant • Senior Data Analyst | ~2 days |
| Phase VII – Report Production Phase Establish permission model, publish final report to Tableau site and create data refresh procedures | • OE – Lead Consultant • Senior Data Analyst | ~1 week |