Factbook and Benchmarks
Growth and Impact
as of Jun. 17, 2022

Total Number of Faculty
111%
2021: 129
2003: 61

Total Pharm.D. Enrollment
44%
2021: 725
2003: 505

Total Ph.D. and M.S. Enrollment
149%
2021: 174
2003: 70

Total Number of Staff
298%
2021: 195
2003: 49

Total External Research Grant Funding
1038%
2021: $48,683,207
2003: $4,278,656
Note: Based on Federal fiscal year.
NIH Research Grant Funding (part of external research funds)
774%
2021: $34,228,570
2003: $3,913,665
Note: Based on Federal fiscal year.
U.S. News & World Report Rank
6 spots
2021: No. 1
2003: No. 7
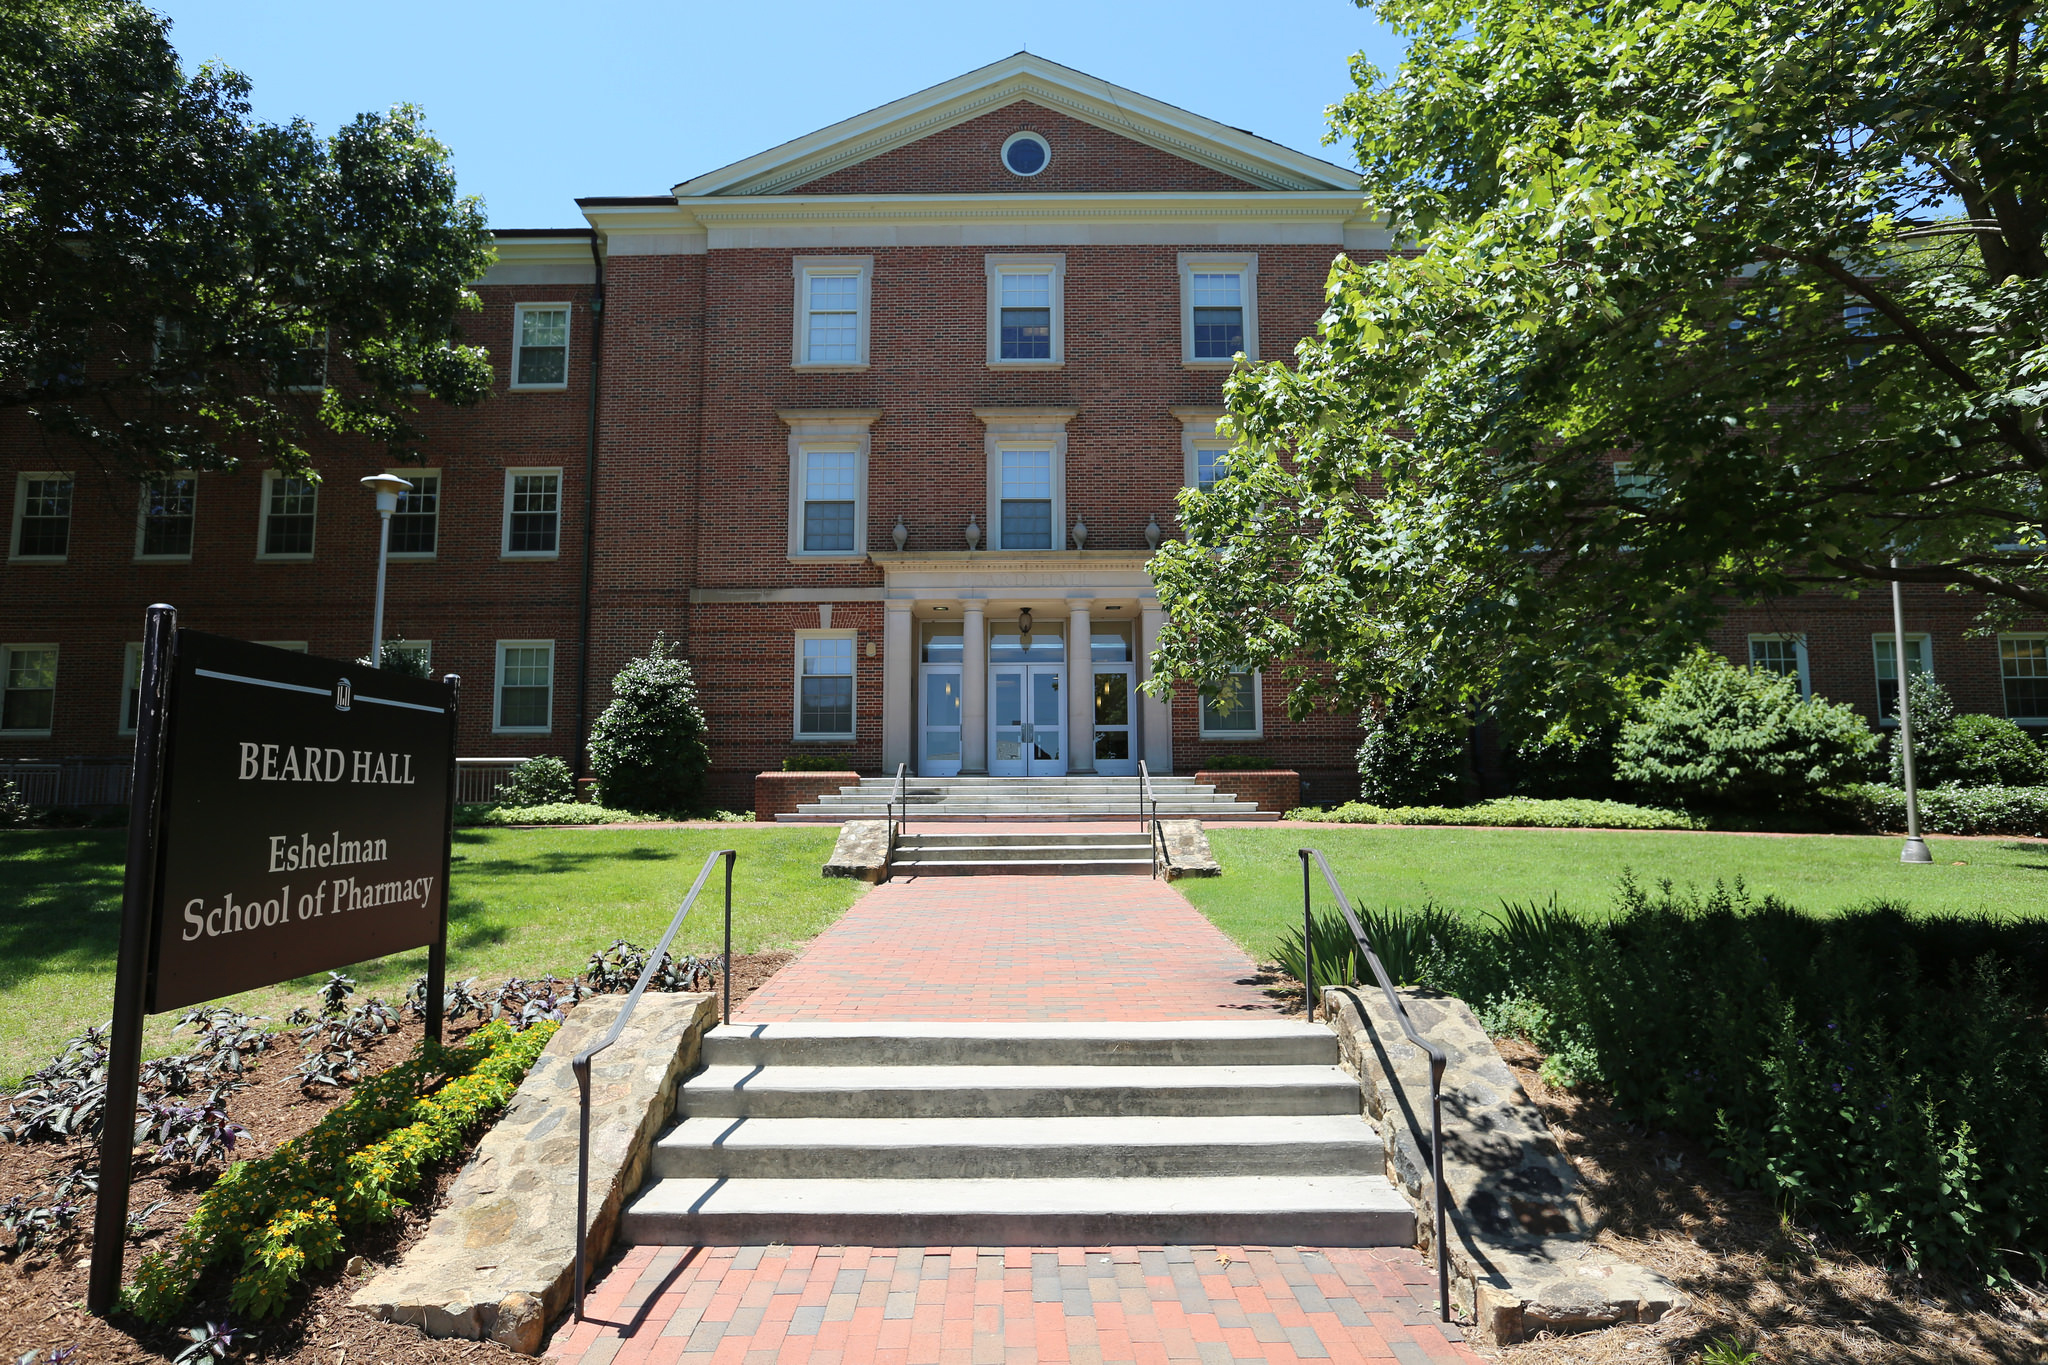
Space (Chapel Hill campus)
98%
2021: 326,527 square feet
2003: 164,507 square feet